ASP.NET Coreでグラフを描いた(その2)
2018年9月29日
2022年1月30日

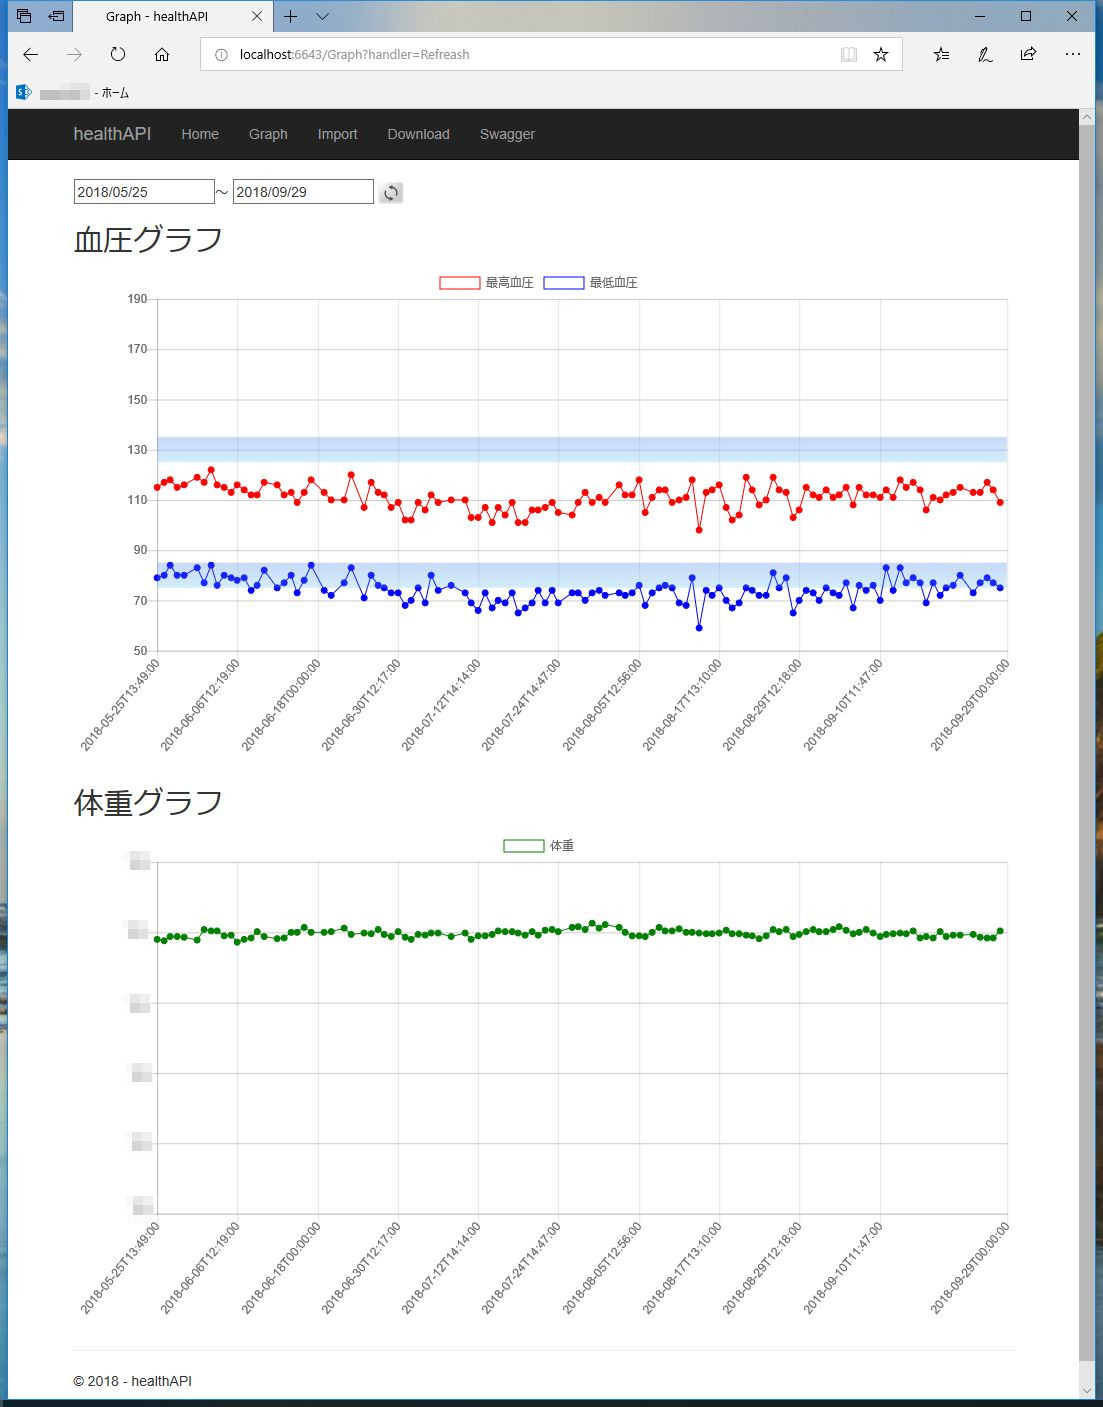
前回のグラフの背景に血圧値の目安線をグラデーションで描いてみた。
Chart.helpers.extendを使って、canvasに描画すればいいらしい。
|
1 2 3 4 5 6 7 8 9 10 11 12 13 14 15 16 17 18 19 20 21 22 23 24 25 26 27 28 29 30 31 32 33 34 35 36 37 38 39 40 41 42 43 44 45 46 47 48 49 50 51 52 53 54 55 56 57 58 59 60 61 62 63 64 65 66 67 68 69 70 71 72 73 74 75 76 77 78 79 80 81 82 83 84 85 86 87 88 89 90 91 92 93 94 95 96 97 98 99 100 101 102 103 104 105 106 107 108 109 110 111 112 113 114 115 116 117 118 119 120 121 122 123 124 125 126 127 128 129 130 131 132 133 134 135 136 137 138 139 140 141 142 143 144 145 146 147 148 149 150 151 152 153 154 155 156 157 158 159 160 161 162 163 164 165 166 167 168 169 170 171 172 173 174 175 176 177 178 179 180 181 182 183 184 185 186 187 188 189 190 191 192 193 194 195 196 197 198 199 200 201 202 203 204 205 206 207 208 209 |
@page @model healthAPI.Pages.GraphModel @using System.Data; @{ var XLabels = Newtonsoft.Json.JsonConvert.SerializeObject(Model.BloodList.Select(x => x.Date).ToList()); var YValuesMax = Newtonsoft.Json.JsonConvert.SerializeObject(Model.BloodList.Select(x => x.Max).ToList()); var YValuesMin = Newtonsoft.Json.JsonConvert.SerializeObject(Model.BloodList.Select(x => x.Min).ToList()); var YValuesWeight = Newtonsoft.Json.JsonConvert.SerializeObject(Model.BloodList.Select(x => x.Weight).ToList()); ViewData["Title"] = "Graph"; } <!DOCTYPE html> <html> <head> <meta name="viewport" content="width=device-width" /> <title>Graph</title> <script src="https://cdnjs.cloudflare.com/ajax/libs/Chart.js/2.7.2/Chart.bundle.min.js"></script> <script src="https://code.jquery.com/jquery-3.3.1.min.js"></script> </head> <body> <br /> <form method="post" asp-page-handler="Refreash" > <input type="date" name="fromDate" asp-for="@Model.FromDate"/>~ <input type="date" name="toDate" asp-for="@Model.ToDate"/> <input type="image" src="~/images/reload.png" align="center" height="22" width="26"/> </form> <p> <h2>血圧グラフ</h2> </p> <div class="box-body"> <div class="chart-container"> <canvas id="chart" style="width:100%; height:500px"></canvas> </div> </div> <p> <h2>体重グラフ</h2> </p> <div class="box-body"> <div class="chart-container"> <canvas id="chart2" style="width:100%; height:500px"></canvas> </div> </div> </body> </html> <script type="text/javascript"> $(function () { var chartName = "chart"; var ctx = document.getElementById(chartName).getContext('2d'); var data = { labels: @Html.Raw(XLabels), datasets: [{ label: "最高血圧", backgroundColor: 'rgba(255, 255, 255, 0)', fill: false, borderColor: 'rgba(255,0,0,1)', borderWidth: 1, data: @Html.Raw(YValuesMax), spanGaps: true,// データが無い線を連結 tension: 0,//カーブした線じゃない pointRadius: 3,// 点の大きさ pointBackgroundColor: 'rgba(255, 0, 0, 1)'// 点の色 }, { label: "最低血圧", backgroundColor: 'rgba(255, 255, 255, 0)', fill: false, borderColor: 'rgba(0,0,255,1)', borderWidth: 1, data: @Html.Raw(YValuesMin), spanGaps: true, tension: 0, pointRadius: 3, pointBackgroundColor: 'rgba(0, 0, 255, 1)' }], yHighlightRange1: { begin: 125, end: 135 }, yHighlightRange2: { begin: 75, end: 85 }, }; var options = { maintainAspectRatio: false, scales: { yAxes: [{ ticks: { max: 190, min: 50, beginAtZero: false, stepSize: 20 }, gridLines: { display: true, color: "rgba(0,0,0,0.2)" } }] } }; var originalLineDraw = Chart.controllers.line.prototype.draw; Chart.helpers.extend(Chart.controllers.line.prototype, { draw: function () { var chart = this.chart; var yHighlightRange1 = chart.config.data.yHighlightRange1; if (yHighlightRange1 !== undefined) { var ctx = chart.chart.ctx; var xaxis = chart.scales['x-axis-0']; var yaxis = chart.scales['y-axis-0']; var yRange1Begin = yHighlightRange1.begin; var yRange1End = yHighlightRange1.end; var yRange1BeginPixel = yaxis.getPixelForValue(yRange1Begin); var yRange1EndPixel = yaxis.getPixelForValue(yRange1End); var grad = ctx.createLinearGradient(xaxis.left, Math.min(yRange1BeginPixel, yRange1EndPixel), xaxis.left, Math.max(yRange1BeginPixel, yRange1EndPixel)); grad.addColorStop(0, 'rgba(100, 149, 237, 0.2)'); grad.addColorStop(1, 'rgba(135, 206, 250, 0.2)'); ctx.save(); ctx.fillStyle = grad; ctx.fillRect(xaxis.left, Math.min(yRange1BeginPixel, yRange1EndPixel), xaxis.right - xaxis.left, Math.max(yRange1BeginPixel, yRange1EndPixel) - Math.min(yRange1BeginPixel, yRange1EndPixel)); ctx.restore(); } var yHighlightRange2 = chart.config.data.yHighlightRange2; if (yHighlightRange2 !== undefined) { var ctx = chart.chart.ctx; var xaxis = chart.scales['x-axis-0']; var yaxis = chart.scales['y-axis-0']; var yRange2Begin = yHighlightRange2.begin; var yRange2End = yHighlightRange2.end; var yRange2BeginPixel = yaxis.getPixelForValue(yRange2Begin); var yRange2EndPixel = yaxis.getPixelForValue(yRange2End); var grad = ctx.createLinearGradient(xaxis.left, Math.min(yRange2BeginPixel, yRange2EndPixel), xaxis.left, Math.max(yRange2BeginPixel, yRange2EndPixel)); grad.addColorStop(0, 'rgba(100, 149, 237, 0.2)'); grad.addColorStop(1, 'rgba(135, 206, 250, 0.2)'); ctx.save(); ctx.fillStyle = grad; ctx.fillRect(xaxis.left, Math.min(yRange2BeginPixel, yRange2EndPixel), xaxis.right - xaxis.left, Math.max(yRange2BeginPixel, yRange2EndPixel) - Math.min(yRange2BeginPixel, yRange2EndPixel)); ctx.restore(); } originalLineDraw.apply(this, arguments); } }); var myChart = new Chart(ctx, { options: options, data: data, type: 'line' }); ///////////////////////// var chartName2 = "chart2"; var ctx2 = document.getElementById(chartName2).getContext('2d'); var data2 = { labels: @Html.Raw(XLabels), datasets: [{ label: "体重", backgroundColor: 'rgba(255, 255, 255, 0)', borderColor: 'rgba(0,127,0,1)', fill: false, borderWidth: 1, data: @Html.Raw(YValuesWeight), spanGaps: true, tension: 0, pointRadius: 3, pointBackgroundColor: 'rgba(0, 127, 0, 1)' }] }; var options2 = { maintainAspectRatio: false, scales: { yAxes: [{ ticks: { max: ヒミツ, min: ヒミツ, beginAtZero: false, stepSize: 10 }, gridLines: { display: true, color: "rgba(0,0,0,0.2)" } }] } }; var myChart2 = new Chart(ctx2, { options: options2, data: data2, type: 'line' }); }); </script> |
なかなか良い。(o^-‘)b グッ!
—
参考サイト
http://www.html5.jp/canvas/how4.html