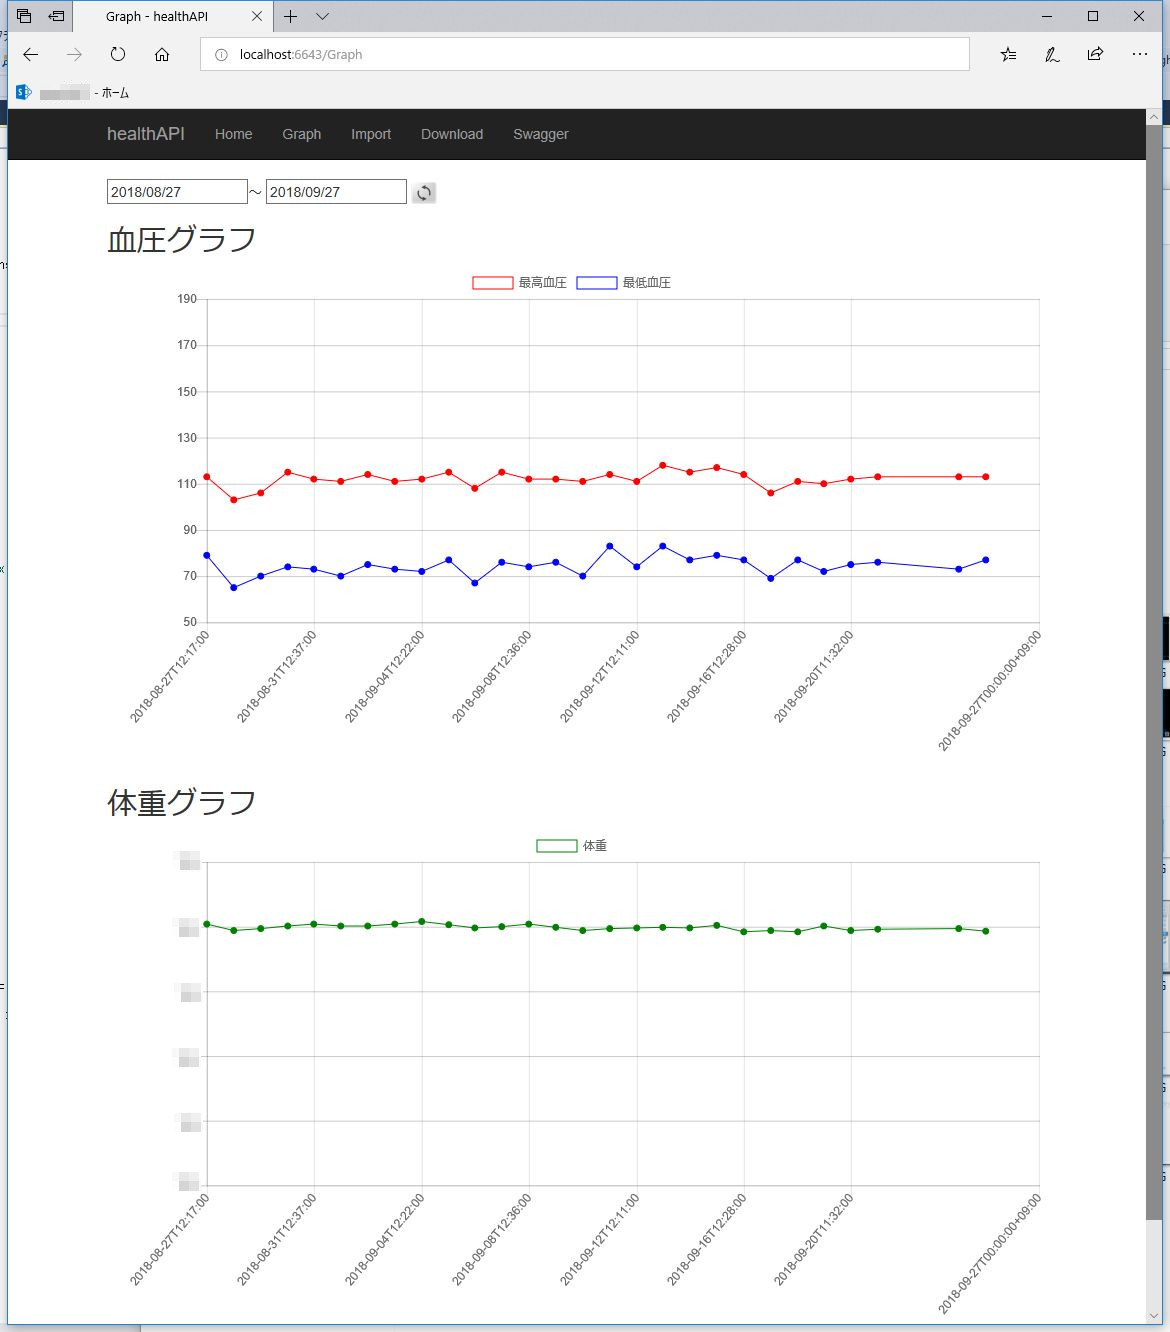
ASP.NET Coreでグラフを描いた
2018年9月27日
2022年1月30日

自宅サーバーのDBに保存してる血圧アプリのバックアップデータをブラウザで見れるようにしようと思い。
C#でしかもlinuxでホストできるということで、ASP.NET Coreで作った。
グラフは、Chart.js。
|
1 2 3 4 5 6 7 8 9 10 11 12 13 14 15 16 17 18 19 20 21 22 23 24 25 26 27 28 29 30 31 32 33 34 35 36 37 38 39 40 41 42 43 44 45 46 47 48 49 50 51 52 53 54 55 56 57 58 59 60 61 62 63 64 65 66 67 68 69 70 71 72 73 74 75 76 77 78 79 80 81 82 83 84 85 86 87 88 89 90 91 92 93 94 95 96 97 98 99 100 101 102 103 104 105 106 107 108 109 110 111 112 113 114 115 116 117 118 119 120 121 122 123 124 125 126 127 128 129 130 131 132 133 134 135 136 137 138 139 140 141 142 143 144 145 146 147 |
@page @model healthAPI.Pages.GraphModel @using System.Data; @{ var XLabels = Newtonsoft.Json.JsonConvert.SerializeObject(Model.BloodList.Select(x => x.Date).ToList()); var YValuesMax = Newtonsoft.Json.JsonConvert.SerializeObject(Model.BloodList.Select(x => x.Max).ToList()); var YValuesMin = Newtonsoft.Json.JsonConvert.SerializeObject(Model.BloodList.Select(x => x.Min).ToList()); var YValuesWeight = Newtonsoft.Json.JsonConvert.SerializeObject(Model.BloodList.Select(x => x.Weight).ToList()); ViewData["Title"] = "Graph"; } <!DOCTYPE html> <html> <head> <meta name="viewport" content="width=device-width" /> <title>Graph</title> <script src="https://cdnjs.cloudflare.com/ajax/libs/Chart.js/2.7.2/Chart.bundle.min.js"></script> <script src="https://code.jquery.com/jquery-3.3.1.min.js"></script> </head> <body> <br /> <form method="post" asp-page-handler="Refreash" > <input type="date" name="fromDate" asp-for="@Model.FromDate"/>~ <input type="date" name="toDate" asp-for="@Model.ToDate"/> <input type="image" src="~/images/reload.png" align="center" height="22" width="26"/> </form> <p> <h2>血圧グラフ</h2> </p> <div class="box-body"> <div class="chart-container"> <canvas id="chart" style="width:100%; height:500px"></canvas> </div> </div> <p> <h2>体重グラフ</h2> </p> <div class="box-body"> <div class="chart-container"> <canvas id="chart2" style="width:100%; height:500px"></canvas> </div> </div> </body> </html> <script type="text/javascript"> $(function () { var chartName = "chart"; var ctx = document.getElementById(chartName).getContext('2d'); var data = { labels: @Html.Raw(XLabels), datasets: [{ label: "最高血圧", backgroundColor: 'rgba(255, 255, 255, 0)', fill:false, borderColor: 'rgba(255,0,0,1)', borderWidth: 1, data: @Html.Raw(YValuesMax), spanGaps: true, tension: 0, pointRadius: 3, pointBackgroundColor: 'rgba(255, 0, 0, 1)' }, { label: "最低血圧", backgroundColor: 'rgba(255, 255, 255, 0)', fill: false, borderColor: 'rgba(0,0,255,1)', borderWidth: 1, data: @Html.Raw(YValuesMin), spanGaps: true, tension: 0, pointRadius: 3, pointBackgroundColor: 'rgba(0, 0, 255, 1)' }] }; var options = { maintainAspectRatio: false, scales: { yAxes: [{ ticks: { max: 190, min: 50, beginAtZero: false, stepSize: 20 }, gridLines: { display: true, color: "rgba(0,0,0,0.2)" } }] } }; var myChart = new Chart(ctx, { options: options, data: data, type: 'line' }); var chartName2 = "chart2"; var ctx2 = document.getElementById(chartName2).getContext('2d'); var data2 = { labels: @Html.Raw(XLabels), datasets: [{ label: "体重", backgroundColor: 'rgba(255, 255, 255, 0)', borderColor: 'rgba(0,127,0,1)', fill: false, borderWidth: 1, data: @Html.Raw(YValuesWeight), spanGaps: true, tension: 0, pointRadius: 3, pointBackgroundColor: 'rgba(0, 127, 0, 1)' }] }; var options2 = { maintainAspectRatio: false, scales: { yAxes: [{ ticks: { max: ヒミツ, min: ヒミツ, beginAtZero: false, stepSize: 10 }, gridLines: { display: true, color: "rgba(0,0,0,0.2)" } }] } }; var myChart2 = new Chart(ctx2, { options: options2, data: data2, type: 'line' }); }); </script> |
|
1 2 3 4 5 6 7 8 9 10 11 12 13 14 15 16 17 18 19 20 21 22 23 24 25 26 27 28 29 30 31 32 33 34 35 36 37 38 39 40 41 42 43 44 45 46 47 48 49 50 51 52 53 54 55 56 57 58 59 60 61 62 63 64 65 66 67 68 69 70 71 72 73 74 75 76 77 78 79 80 81 82 83 84 |
using System; using System.Collections.Generic; using System.Diagnostics; using System.Linq; using System.Threading.Tasks; using healthAPI.Data; using healthAPI.Models; using Microsoft.AspNetCore.Mvc; using Microsoft.AspNetCore.Mvc.RazorPages; using Microsoft.EntityFrameworkCore; namespace healthAPI.Pages { public class GraphModel : PageModel { public healthAPIDbContext DbContext { get; } [BindProperty] public DateTime FromDate { get; set; } = DateTime.Now.AddMonths(-1); [BindProperty] public DateTime ToDate { get; set; } = DateTime.Now; public GraphModel(healthAPIDbContext context) { DbContext = context; } public IList<BloodModel> BloodList { get; set; } [HttpPost] public async Task OnPostRefreash([FromForm]DateTime fromDate, [FromForm]DateTime toDate) { try { FromDate = fromDate; ToDate = toDate; BloodList = await MakeBloodList(); } catch (Exception e) { Debug.WriteLine(e.Message); } } [HttpGet] public async Task OnGetAsync() { try { BloodList = await MakeBloodList(); } catch (Exception e) { Debug.WriteLine(e.Message); } } private async Task<IList<BloodModel>> MakeBloodList() { var list = new List<BloodModel>(); try { for (DateTime i = FromDate.Date; i <= ToDate.Date; i = i.AddDays(1)) { var data = await DbContext.BloodModels.Where(x => x.Date.Value.Date == i.Date).OrderBy(x => x.Date).ToListAsync(); if (data?.Count > 0) { list.AddRange(data); } else { list.Add(new BloodModel() { Date = i.Date }); } } } catch (Exception e) { Debug.WriteLine(e.Message); } return list; } } } |
C#のソースの方に処理を書けば、コントローラーを別途作らなくてもいいんだな。web系素人なのでこれは楽だ。
できた。(∩´∀`)∩ワーイ
—
参考サイト
https://www.c-sharpcorner.com/article/creating-charts-with-asp-net-core/
http://www.chartjs.org/docs/2.7.2/axes/cartesian/linear.html