XamarinでOxyPlotでグラフを描いた
2017年5月4日
2022年4月19日
血圧アプリでグラフを表示しようと思い。
OxyPlotで簡単に描けそうだったのでやってみた。
– 手順 –
1.OxyPlotを入れる
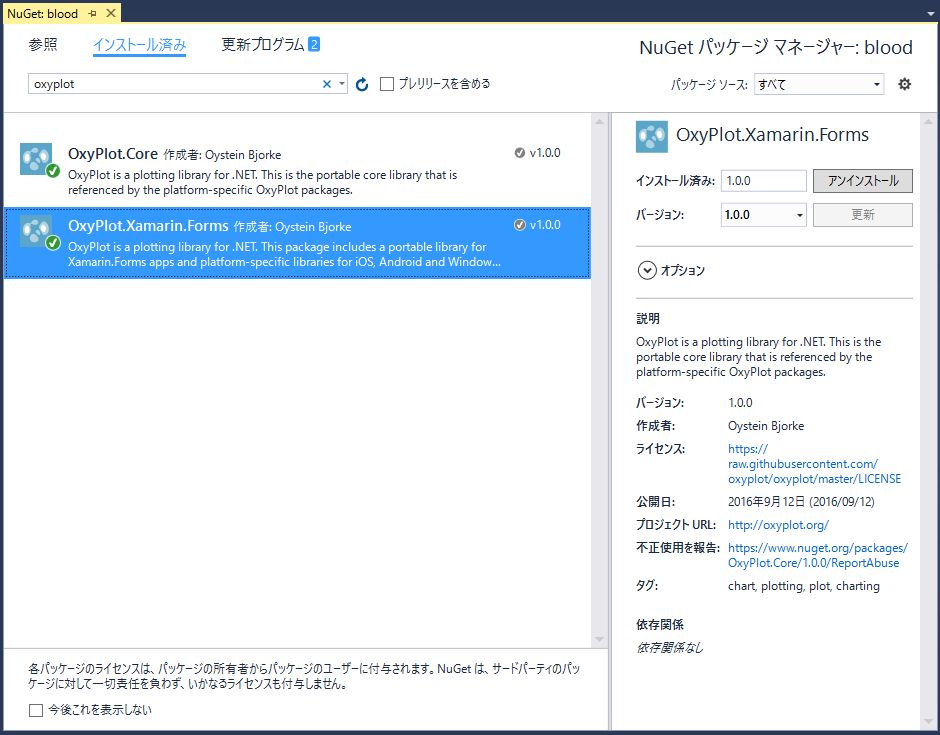
NuGetでOxyPlotで検索すると出てくる。
iOS、Android、UWPのプロジェクトにも追加する。
2.グラフを描く
①XAML
|
1 2 3 4 5 6 7 8 9 10 11 12 13 14 15 16 17 18 19 20 |
<?xml version="1.0" encoding="utf-8" ?> <ContentPage xmlns="http://xamarin.com/schemas/2014/forms" xmlns:x="http://schemas.microsoft.com/winfx/2009/xaml" x:Class="blood.View.BloodGraphView" xmlns:vm="clr-namespace:blood.ViewModel" xmlns:bhv="clr-namespace:blood.Behavior" xmlns:oxy="clr-namespace:OxyPlot.Xamarin.Forms;assembly=OxyPlot.Xamarin.Forms" BindingContext="{x:Static vm:ViewModelLocator.BloodGraph}"> <ContentPage.Behaviors> <bhv:EventToCommandBehavior EventName="Appearing" Command="{Binding AppearingCommand}"/> </ContentPage.Behaviors> <Grid> <Grid.RowDefinitions> <RowDefinition Height="1.5*"></RowDefinition> <RowDefinition Height="1*"></RowDefinition> </Grid.RowDefinitions> <oxy:PlotView Model="{Binding PlotModelPressure}" VerticalOptions="LayoutOptions.Fill" HorizontalOptions="LayoutOptions.Fill" /> <oxy:PlotView Grid.Row="1" Model="{Binding PlotModelWeight}" VerticalOptions="LayoutOptions.Fill" HorizontalOptions="LayoutOptions.Fill" /> </Grid> </ContentPage> |
ビヘイビアでやったけど、ViewModelのコンストラクタでも良いかも。
②ViewModel
|
1 2 3 4 5 6 7 8 9 10 11 12 13 14 15 16 17 18 19 20 21 22 23 24 25 26 27 28 29 30 31 32 33 34 35 36 37 38 39 40 41 42 43 44 45 46 47 48 49 50 51 52 53 54 55 56 57 58 59 60 61 62 63 64 65 66 67 68 69 70 71 72 73 74 75 76 77 78 79 80 81 82 83 84 85 86 87 88 89 90 91 92 93 94 95 96 97 98 99 100 101 102 103 104 105 106 107 108 109 110 111 112 113 114 115 116 117 118 119 120 121 122 123 124 125 126 127 128 129 130 131 |
private RelayCommand<object> _AppearingCommand; /// <summary> /// AppearingCommand /// </summary> public RelayCommand<object> AppearingCommand { get { if (_AppearingCommand == null) { _AppearingCommand = new RelayCommand<object>((e) => { if (BloodList == null) return; var list = BloodList.OrderBy(x => x.Date); var maxDate = DateTimeAxis.ToDouble(list.Max(x => x.Date)); var minDate = DateTimeAxis.ToDouble(list.Min(x => x.Date)); var model = new PlotModel() { Title = "血圧グラフ", Background = OxyColors.White }; var axisX = new DateTimeAxis() { Title = "日付", Position = AxisPosition.Bottom, Maximum = maxDate, Minimum = minDate, MajorGridlineStyle = LineStyle.Solid, MinorGridlineStyle = LineStyle.Dot, }; model.Axes.Add(axisX); var axisY = new LinearAxis() { Title = "血圧", Position = AxisPosition.Left, Maximum = 150, Minimum = 50, MajorStep = 10, MajorGridlineStyle = LineStyle.Solid, MinorGridlineStyle = LineStyle.Dot, }; model.Axes.Add(axisY); var seriesMax = new LineSeries() { ItemsSource = list, DataFieldX = "Date", DataFieldY = "Max", MarkerType = MarkerType.Circle, MarkerSize = 2, MarkerStroke = OxyColors.Red, MarkerStrokeThickness = 1, MarkerFill = OxyColors.Pink, Color = OxyColors.Red, StrokeThickness = 1, }; model.Series.Add(seriesMax); var seriesMin = new LineSeries() { ItemsSource = list, DataFieldX = "Date", DataFieldY = "Min", MarkerType = MarkerType.Circle, MarkerSize = 2, MarkerStroke = OxyColors.Blue, MarkerStrokeThickness = 1, MarkerFill = OxyColors.SkyBlue, Color = OxyColors.Blue, StrokeThickness = 1, }; model.Series.Add(seriesMin); PlotModelPressure = model; var modelWeight = new PlotModel() { Title = "体重グラフ", Background = OxyColors.White, IsLegendVisible = true }; modelWeight.Axes.Add(new DateTimeAxis() { Title = "日付", Position = AxisPosition.Bottom, Maximum = maxDate, Minimum = minDate, MajorGridlineStyle = LineStyle.Solid, MinorGridlineStyle = LineStyle.Dot, }); modelWeight.Axes.Add(new LinearAxis() { Title = "体重", Position = AxisPosition.Left, Maximum = xx, Minimum = xx, MajorStep = 10, MajorGridlineStyle = LineStyle.Solid, MinorGridlineStyle = LineStyle.Dot, }); modelWeight.Series.Add(new LineSeries() { ItemsSource = list, DataFieldX = "Date", DataFieldY = "Weight", MarkerType = MarkerType.Circle, MarkerSize = 2, MarkerStroke = OxyColors.DarkGreen, MarkerStrokeThickness = 1, MarkerFill = OxyColors.Green, Color = OxyColors.DarkGreen, StrokeThickness = 1, }); PlotModelWeight = modelWeight; }); } return _AppearingCommand; } } |
③各プラットフォームの設定
ドキュメント(http://docs.oxyplot.org/en/latest/getting-started/hello-xamarin-forms.html)を参考に、各プラットフォームに初期化処理を入れる。
|
1 2 3 4 |
public override bool FinishedLaunching(UIApplication app, NSDictionary options) { global::Xamarin.Forms.Forms.Init(); OxyPlot.Xamarin.Forms.Platform.iOS.PlotViewRenderer.Init(); |
3.実行
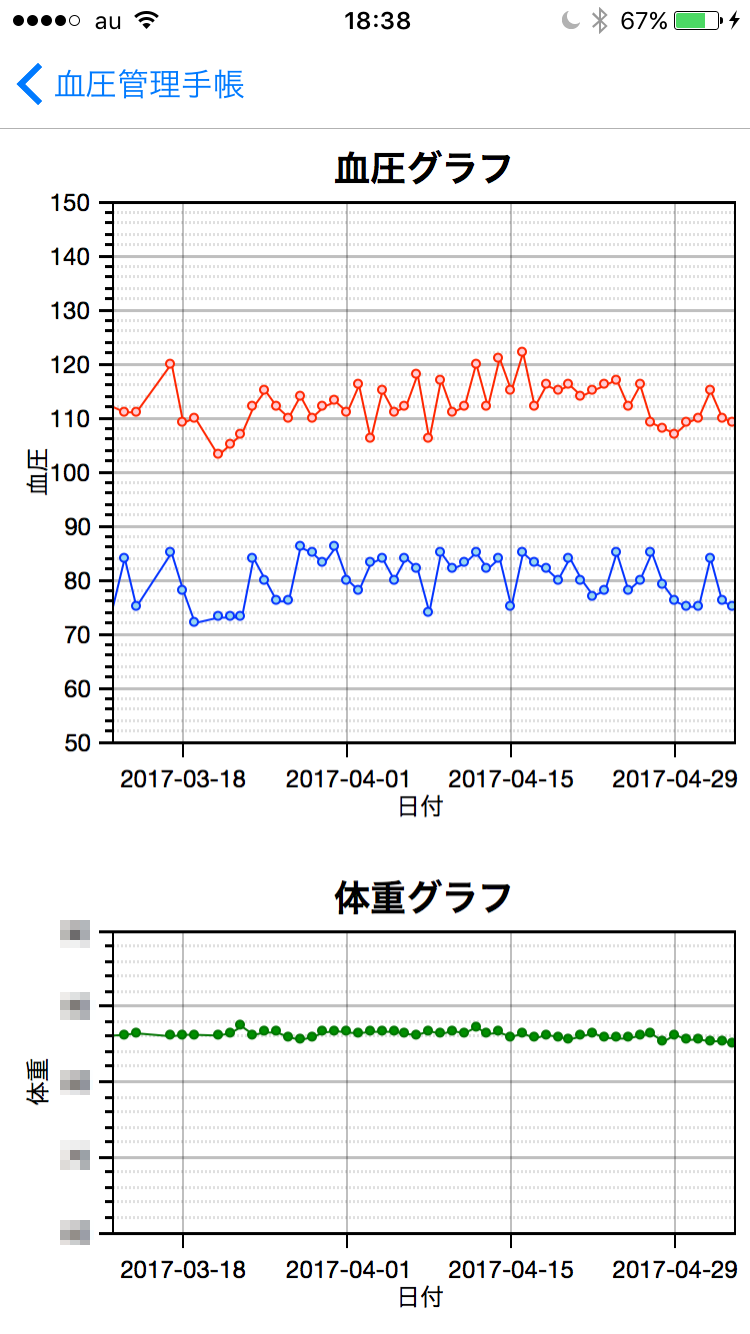
できた(∩´∀`)∩
スワイプで追加読み込みとかにした方が使いやすいだろうな。。
—
参考サイト
http://docs.oxyplot.org/en/latest/index.html
http://crocus7724.hatenablog.jp/entry/2016/02/22/233500
http://santea.hateblo.jp/entry/2016/05/02/015326

