Geiger8 その4
2013年5月27日
JsonからListになったので、Chart表示にとりかかる。
が、50件くらいしか表示できない。
メモリ制約とかあるのかな?
XAML Toolkit のChartの問題か?
|
1 2 3 4 5 6 7 8 9 10 11 12 13 14 15 16 17 18 19 20 21 22 23 24 25 26 27 28 29 30 31 32 33 34 35 36 37 |
// 月でグループ化 var gropList = from a in jo group a by a.date.Substring(0,7) into grouping select grouping; // itemsource作成 List<NameValueItemList> data = new List<NameValueItemList>(); foreach (IGrouping<string, CPMInfo> grp in gropList) { NameValueItemList list = new NameValueItemList(); list.Title = grp.Key; var test = new List<KeyValuePair<string, int>>(); foreach (CPMInfo cpms in grp) { test.Add(new KeyValuePair<string, int>(cpms.date, cpms.data)); } list.Datas = test.Take(50).Select((x) => new NameValueItem() { Key = x.Key, Value = x.Value }).ToList(); var polyfit = new Polyfit(test, 5); list.Polyfit = polyfit.Take(50).Select((x) => new NameValueItem() { Key = x.Key, Value = x.Value }).ToList(); data.Add(list); } this.gvResult.ItemsSource = data; } public class NameValueItem { public string Key { get; set; } public int Value { get; set; } } public class NameValueItemList { public string Title { get; set; } public List<NameValueItem> Datas { get; set; } public List<NameValueItem> Polyfit { get; set; } } |
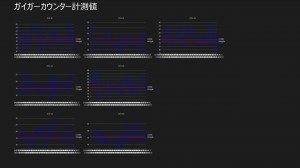
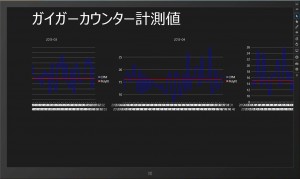
シミュレーターで表示、
全月を表示すると遅いから、レイアウトも変更しないとだな。

