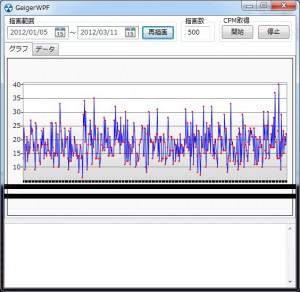
<Grid.Resources>
<ControlTemplate x:Key=”mark_template”>
<Ellipse Fill=”Red” Width=”3″ Height=”3″ />
</ControlTemplate>
</Grid.Resources>
<chartingToolkit:Chart Name=”chart_data”>
<chartingToolkit:Chart.LegendStyle>
<Style TargetType=”HeaderedItemsControl”>
<Setter Property=”Width” Value=”0″/>
<Setter Property=”Height” Value=”0″/>
</Style>
</chartingToolkit:Chart.LegendStyle>
<chartingToolkit:LineSeries DependentValuePath=”Value” IndependentValuePath=”Key” IsSelectionEnabled=”True” ItemsSource=”{Binding}” DataContext=”{Binding}”>
<chartingToolkit:LineSeries.DataPointStyle>
<Style TargetType=”chartingToolkit:LineDataPoint”>
<Setter Property=”Template” Value=”{StaticResource ResourceKey=mark_template}”/>
<Setter Property=”Background” Value=”Blue”/>
</Style>
</chartingToolkit:LineSeries.DataPointStyle>
<chartingToolkit:LineSeries.PolylineStyle>
<Style TargetType=”{x:Type Polyline}”>
<Setter Property=”StrokeThickness” Value=”1″/>
<Setter Property=”StrokeMiterLimit” Value=”1″/>
</Style>
</chartingToolkit:LineSeries.PolylineStyle>
</chartingToolkit:LineSeries>
</chartingToolkit:Chart> |
